
App State’s performance metrics for 2022–27 reflect the university’s commitment to increase access to a high-quality, cost-effective App State education.
The university’s performance metrics align with the UNC System Strategic Plan and emphasize undergraduate student success, as well as affordability and university productivity.
For each of the metrics, there is:
- a baseline, which is derived from App State’s historical performance in the area; and
- a stretch goal, which is the level of performance App State strives toward.
App State’s funding allocations are tied to success in these areas, with performance weighting based on how actual performance compares to the baseline and stretch goals that are assigned to each metric.
Read on to learn more about App State’s progress in and goals for these areas.
Core Metrics
Four-year Graduation Rate
Timely degree completion — within four years — helps to limit student debt and lowers the opportunity cost of remaining in school for additional semesters, according to the UNC System.
App State has surpassed its 2025 stretch goal of 61.60% for this metric — the institutional four-year graduation rate for first-time, full-time bachelor’s degree-seeking students. The four-year graduation rate for this App State population (2020 cohort) is 61.70%.
App State is 1.13 percentage points away from achieving its 2026 stretch goal of 62.83% for this metric.
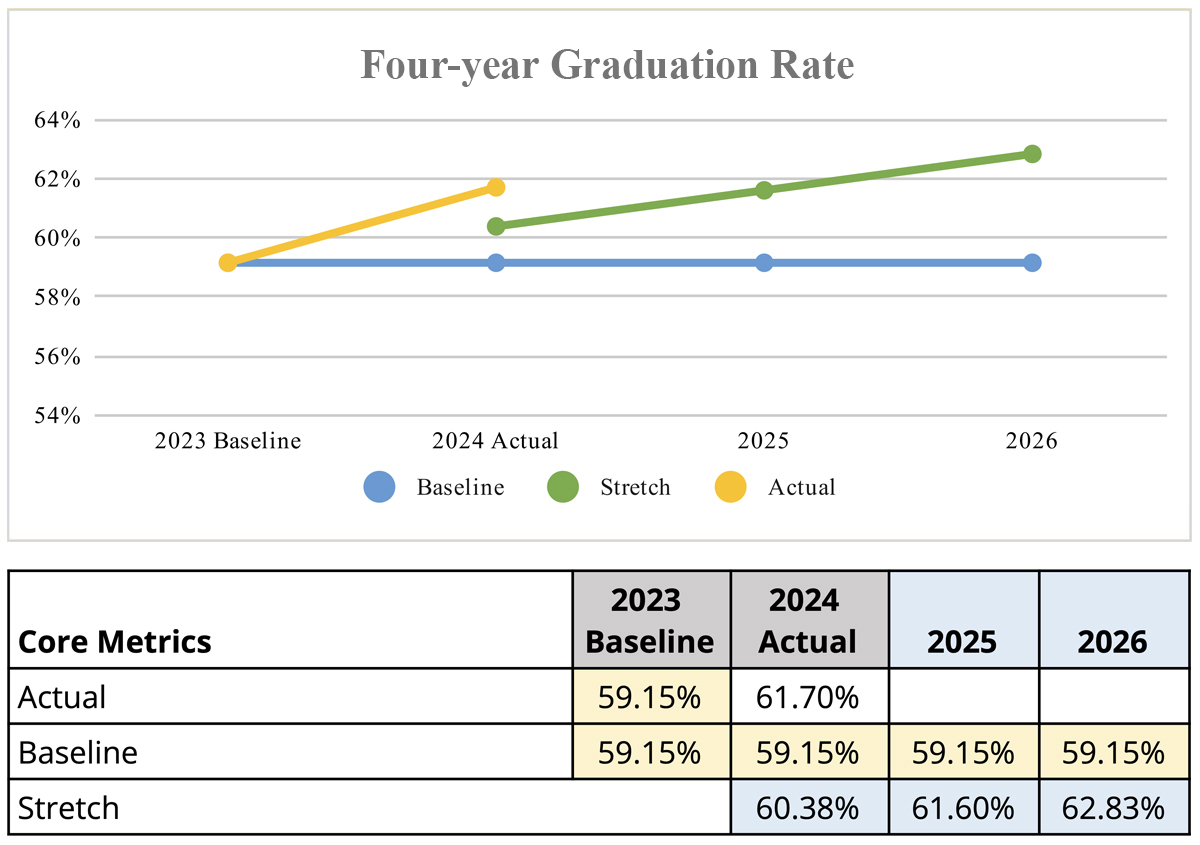 Baseline is derived from App State’s historical performance.
Undergraduate Degree Efficiency
Undergraduate degree efficiency — defined as the number of undergraduate degrees awarded by an institution per 100 full-time equivalent (FTE) undergraduates — is a more holistic measure of student success than graduation rate, according to the UNC System. This metric captures the success of students beyond first-time, full-time, first-year students and includes those who transfer to a System school and complete a degree.
App State is 4.4% away from achieving its 2026 stretch goal of 23.46 for this metric and 3.4% away from meeting its 2025 stretch goal of 23.24.
 Baseline is derived from App State’s historical performance.
Average Credits Earned Per Year
The ultimate goal of UNC System institutions is to help students graduate on time — allowing graduates to enter the workforce sooner and to avoid unnecessary debt. Across the System, the uniform standard for the number of credits in a major is 120 hours, and this policy ensures that a four-year degree timeline is within reach of practically every full-time student.
Tracking the average credit hours earned per year for full-time undergraduate, degree-seeking students is crucial for ensuring timely graduation and academic success. Numerous data show that first-year students who complete 30 credit hours in their first year are more likely to graduate and to graduate on time. Monitoring this progress helps App State identify students who are at risk of delayed graduation, allowing the university to intervene early and provide necessary support, such as academic counseling or additional resources.
App State is 2.4% away from achieving its 2025 stretch goal of 28.71 credit hours for this metric and 3.4% away from meeting the 2026 stretch goal of 28.97 credit hours.
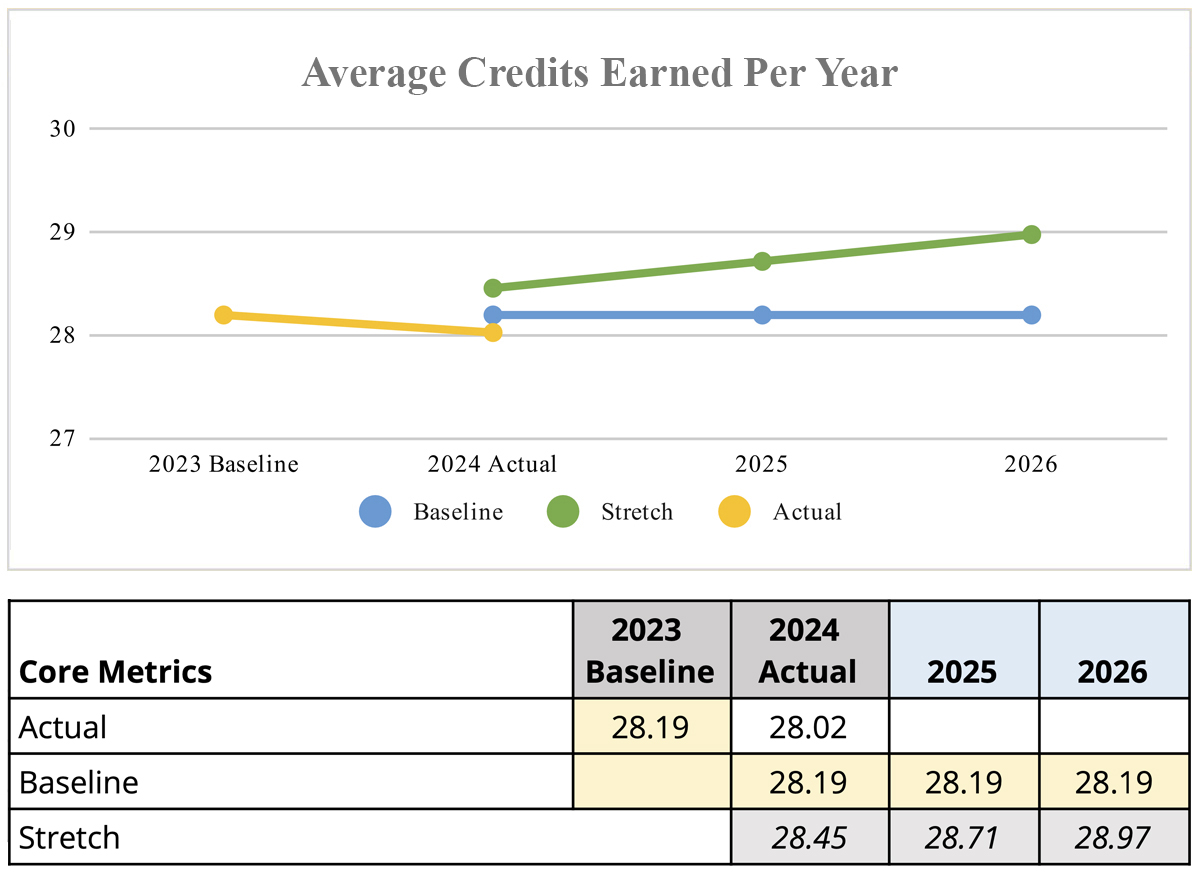 Baseline is derived from App State’s historical performance. Metric considers all bachelor’s degree-seeking, full-time students with fewer than 90 credits at the start of the fall term (credits earned in the fall, spring and summer terms are included).
First-time Student Debt at Graduation
At App State, minimizing student debt starts with a college education that provides great value at an affordable cost. The university aims to reduce the debt that first-time students incur upon graduating and has surpassed its 2025 stretch goal of $9,494 for this metric.
In 2024, each first-time App State student graduated with an average debt of $9,092, which is 13.81% below the 2024 baseline of $10,549 (inflation-adjusted). The university’s 2026 stretch goal for this metric is $8,967.
The student debt goals under this metric acknowledge the potential for inflation-driven increases in components of costs of attendance — such as food, housing and transportation — that could drive growth in student borrowing over the course of 2022–27. Therefore, the goal is to limit increases in the average cumulative federal student loan debt for first-time, first-year students to the rate of inflation each year, with a “stretch” aim of outperforming inflation by reducing average cumulative federal student loan debt at graduation by 15% after accounting for inflation.
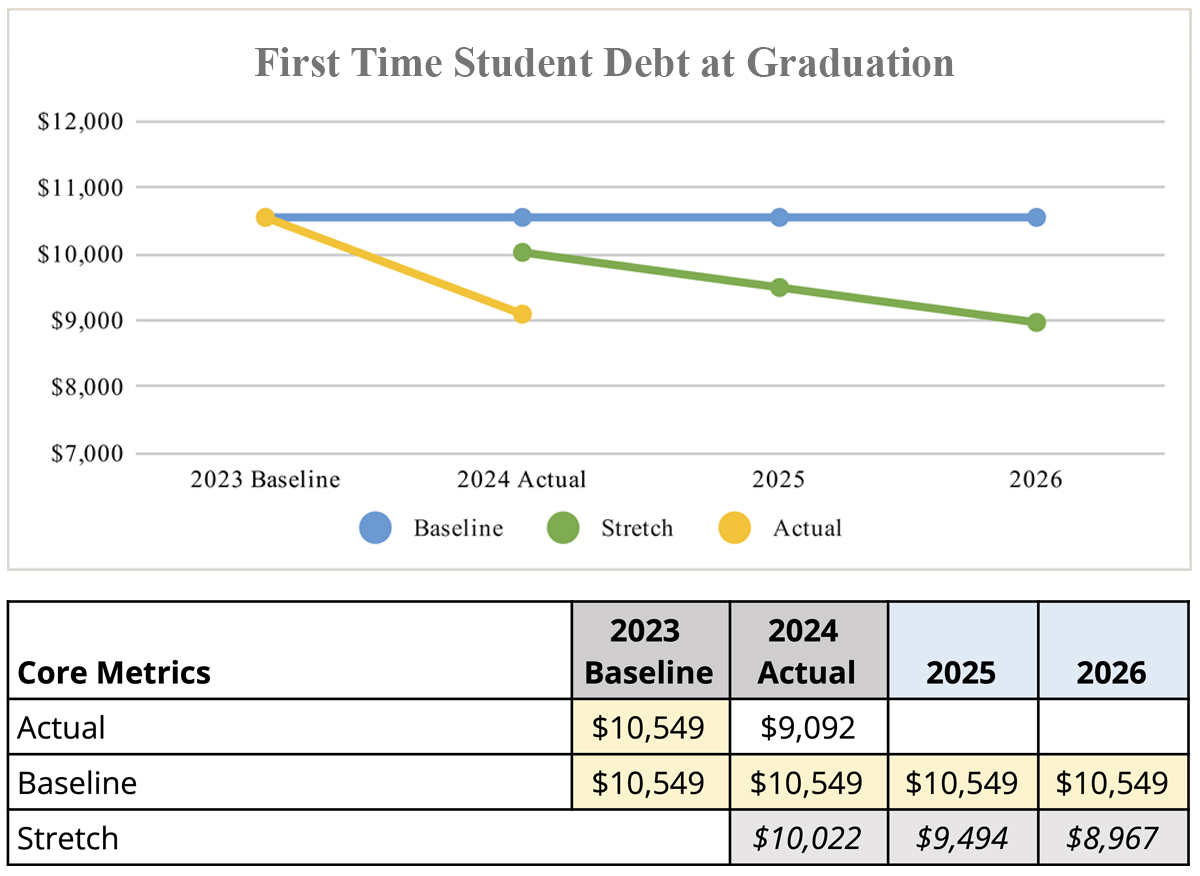 Baseline is adjusted for inflation. Debt stretch goals calculated using these formulas: baseline - (10% x baseline) for 2025 goal; baseline - (15% x baseline) for 2026 goal.
Transfer Student Debt at Graduation
At App State, minimizing student debt starts with a college education that provides great value at an affordable cost. The university aims to reduce the debt that transfer students incur upon graduating.
In 2024, each transfer student graduated from App State with an average debt of $9,071, which is less than 1% below the 2024 baseline of $9,142 (inflation-adjusted). App State is 9.3% away from meeting its 2025 stretch goal of $8,228 for this metric and 14.3% away from achieving its 2026 stretch goal of $7,771.
The student debt goals under this metric acknowledge the potential for inflation-driven increases in components of costs of attendance — such as food, housing and transportation — that could drive growth in student borrowing over the course of 2022–27. Therefore, the goal is to limit increases in the average cumulative federal student loan debt for transfer students to the rate of inflation each year, with a “stretch” aim of outperforming inflation by reducing average cumulative federal student loan debt at graduation by 15% after accounting for inflation.
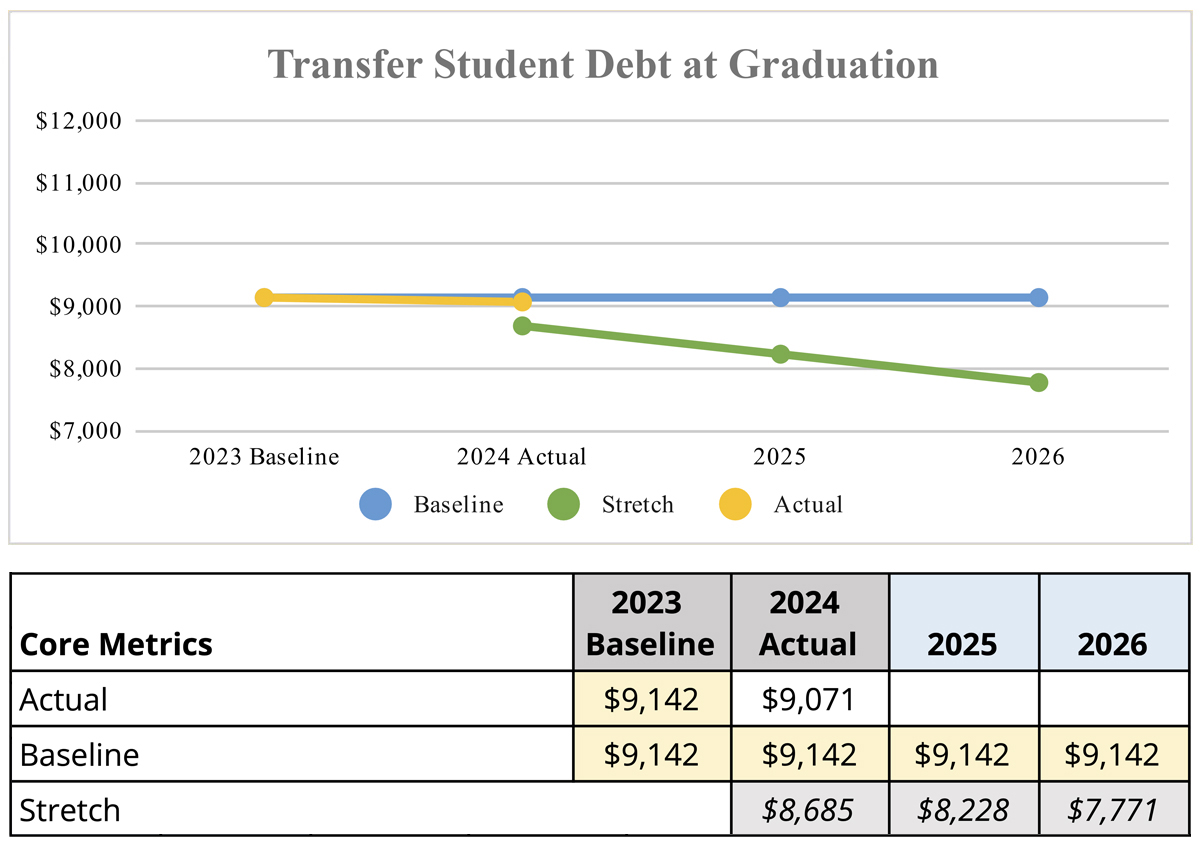 Baseline is adjusted for inflation. Debt stretch goals were calculated using these formulas: baseline - (10% x baseline) for 2025 goal; baseline - (15% x baseline) for 2026 goal.
Education and Related Expenses per Degree
The Education and Related Expenses Per Degree metric measures the productivity of educational spending. The UNC System and its constituent institutions can increase productivity by containing costs and by making investments that maximize both students’ persistence to continue in their students and timely degree completion, leading to increased numbers of graduates.
App State has surpassed its 2024 baseline of $55,224 (inflation-adjusted dollars) for this metric. Currently, the cost of an App State education and related expenses, per degree, stands at $54,674.
App State’s 2025 stretch goal for this metric is $50,806, or 8% below the baseline of $55,224, and the 2026 stretch goal is $48,597 — 12% below the baseline.
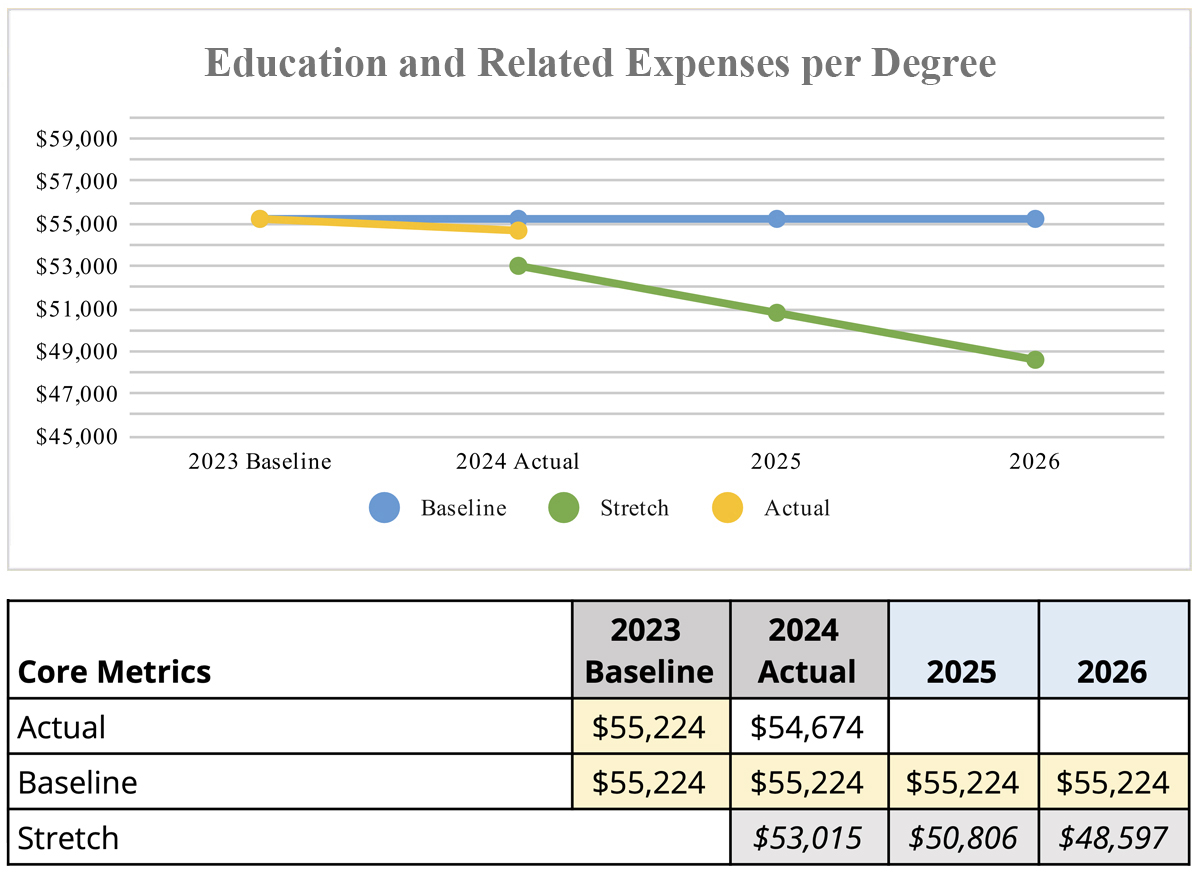 Baseline is adjusted for inflation. Stretch goals were calculated using these formulas: baseline - (8% x baseline) for 2025 goal; baseline - (12% x baseline) for 2026 goal.
Empowering Human Potential
Enrollment Goals
Student Support
Performance Metrics
Five-year Performance Metrics
- Four-year Graduation Rate
- Undergraduate Degree Efficiency
- Average Credits Earned Per Year
- First-time Student Debt at Graduation
- Transfer Student Debt at Graduation
- Education and Related Expenses per Degree
A spirited graduate from the Hayes School of Music. Photo by Marie Freeman